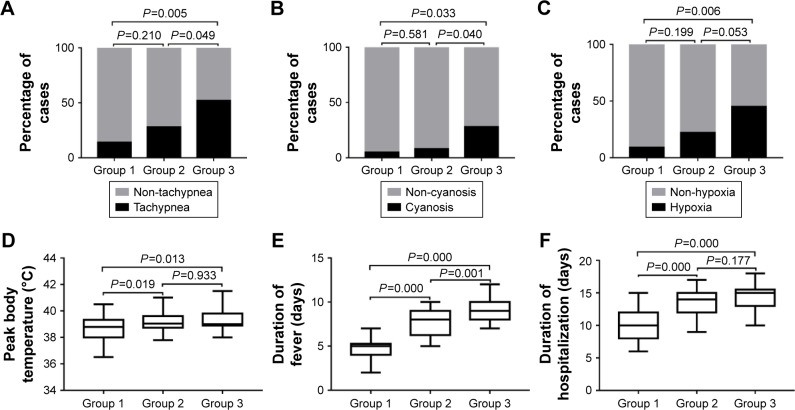
Figure 1.
Comparison of the clinical characteristics with statistically significant differences between the groups.
Notes: (A) Tachypnea. (B) Cyanosis. (C) Hypoxia. (D) Peak body temperature. (E) Duration of fever. (F) Duration of hospitalization. Data in (A–C) are shown as stacked bars (percentage of patients), and data in (D–F) are shown as box-whisker plots (median, minimum to maximum).

