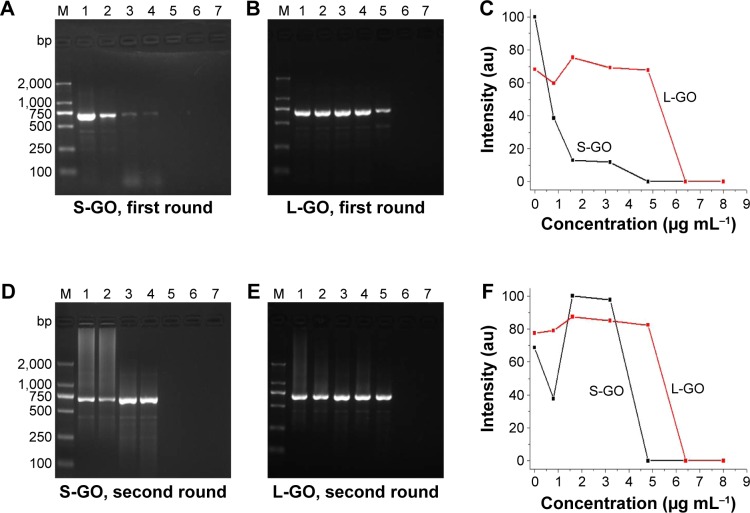
Figure 2.
Effect of GO with different sizes on the first- and second-round PCRs.
Notes: M: DNA marker. (A) S-GO in the first-round PCR. (B) L-GO in the first-round PCR. (C) PCR band intensity at different concentrations of GO in the first-round PCR. (D) S-GO in the second-round PCR. (E) L-GO in the second-round PCR. (F) PCR band intensity at different concentrations of GO in the second-round PCR. The GO concentration in lanes 1–7 is 0 μg mL−1, 0.8 μg mL−1, 1.6 μg mL−1, 3.2 μg mL−1, 4.8 μg mL−1, 6.4 μg mL−1 and 8.0 μg mL−1, respectively.
Abbreviations: GOs, graphene oxides; L-GO, large GO; PCRs, polymerase chain reactions; S-GO, small GO.

