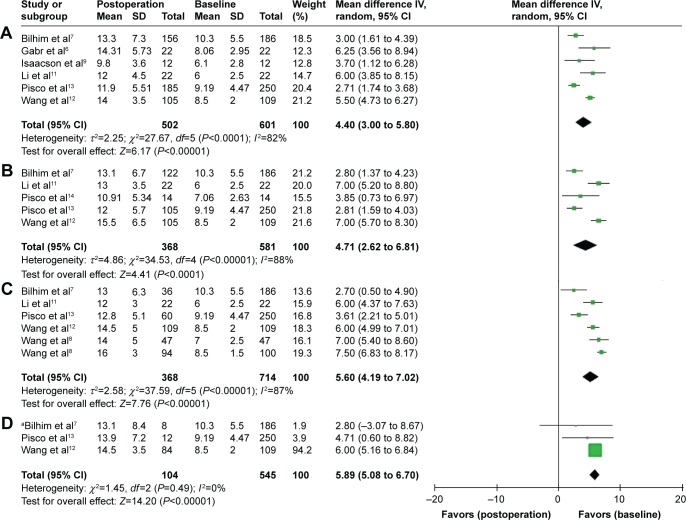
Figure 6.
A forest plot about Qmax changes after PAE at postoperative 1 month (A), 6 months (B), 12 months (C), and 24 months (D).
Note: aUsing the fixed-effects model.
Abbreviations: CI, confidence interval; IV, intravenous; PAE, prostate artery embolization; SD, standard deviation; Qmax, peak urinary flow rate.

