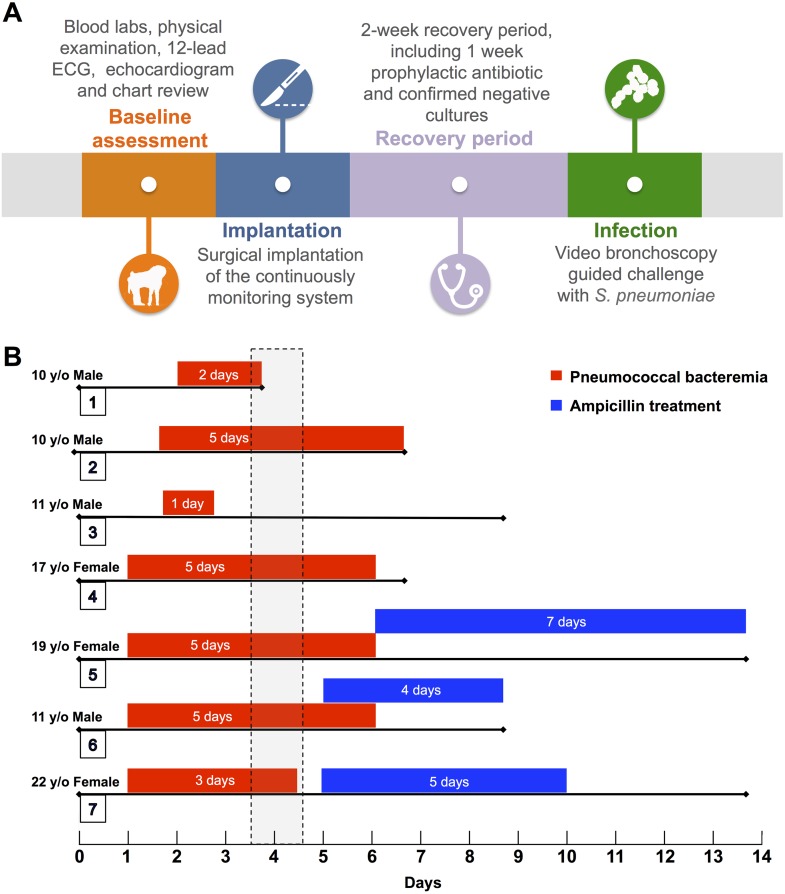
Fig 1. Experiment Overview.
(A) Description of the baseline assessment, implantation, recovery period, and infection. (B) Graphical representation of each experiment following intrabronchial challenge with S. pneumoniae, showing demographics, days with positive blood culture (red bars), onset and duration of antimicrobial therapy (blue bars), and total days of each experiment. Vertical dashed rectangle indicates the time period when a diagnosis of pneumonia was established.

