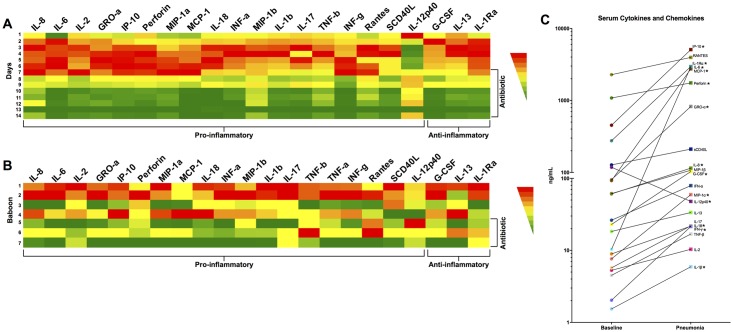
Fig 4. Cytokines and chemokines present in serum and lungs during pneumococcal pneumonia and following antibiotic intervention.
Heat map represents the mean concentration of 20 cytokines and chemokines measured in baboons with pneumococcal pneumonia. Panel A represents mean concentration of cytokines and chemokines in serum of all animals stratified by days post challenge. Panel B show the mean lung homogenized tissue levels of 20 cytokines and chemokines measured at end of the experiment and stratified by individual animal. The color represents the concentration range from highest (red) to lowest (green) for each cytokine/chemokine. (C) Individual values for these cytokines and chemokines in serum at baseline (day 0), and during pneumonia (day 4). Statistical significance (*<0.05) was determined using paired nonparametric Mann-Whitney U tests.

