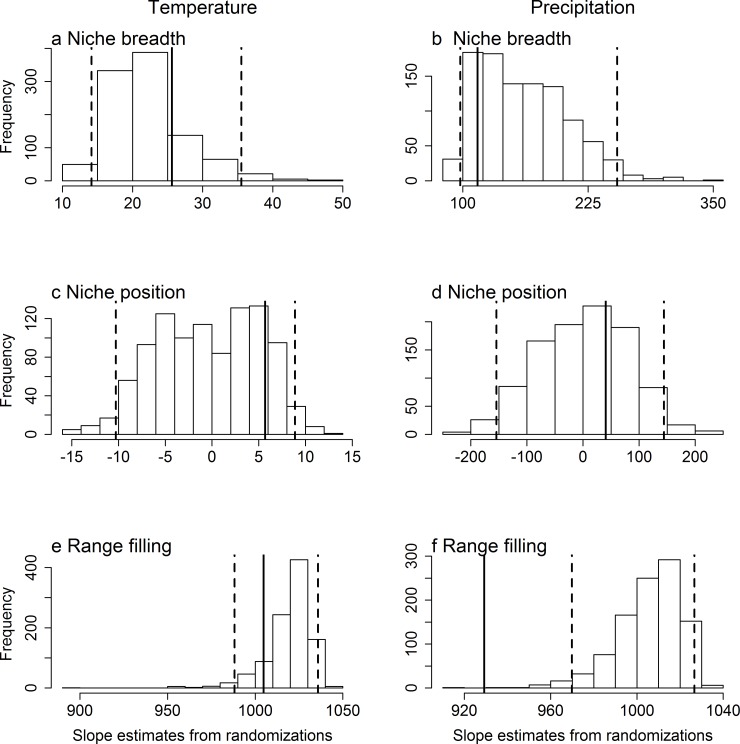
Fig 1. Histograms of expected distribution of slopes between range size and a set of climatic niche characteristics under the null model.
The observed slope of the relationship between range size, measured as number of 104-km2 cells occupied, and (a, b) niche breadth, (c, d) niche position and (e, f) range filling of the occupied (a, c, e) temperature (°C) and (c, d, f) precipitation (mm) is shown by a vertical solid line. The data are from the American geographic ranges of 3277 non-migratory bird and 1659 mammal species, pooled together. The expected distribution of slopes was generated by randomizing the predictor variable, while maintaining spatial autocorrelation in the climatic variables. The vertical dashed lines represent the 2.5% and 97.5% thresholds of the randomizations.

