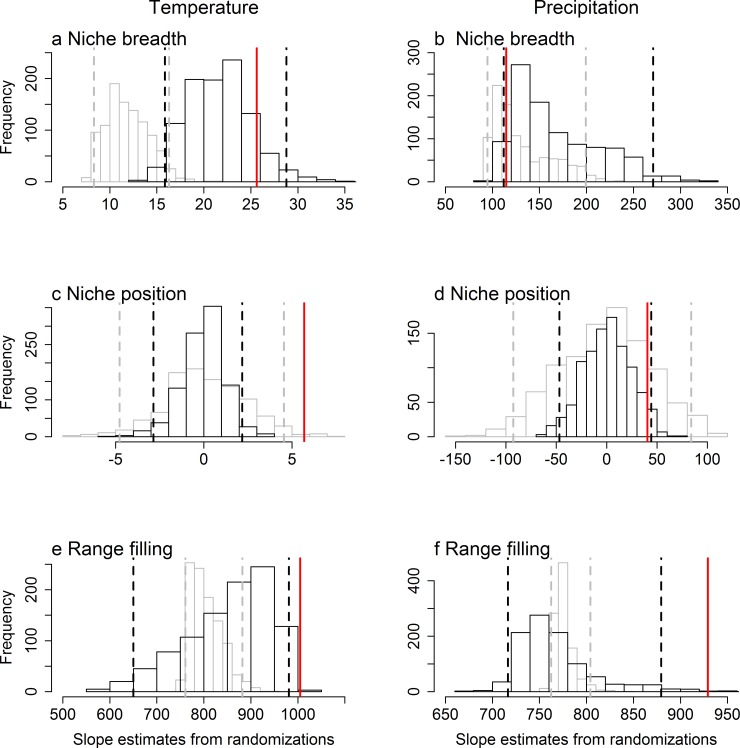
Fig 3. Histograms of expected slopes from power analyses that either incorporate intrinsic spatial autocorrelation (black) or not (gray).
Species geographic ranges were simulated to be probabilistically related to temperature and precipitation while maintaining the range size and climatic niche of real species. The observed slope of the relationship between range size, measured in number of cells occupied, and (a, b) niche breadth, (c, d) niche position and (e, f) range filling of the occupied (a, c, e) temperature (°C) and (c, d, f) precipitation (mm) are shown by vertical solid lines. Cells within a species’ climatic niche either had an equal probability of being occupied (i.e., ranges are not necessarily cohesive, shown in gray), or range cohesion, and thereby intrinsic spatial autocorrelation, was modelled through a spreading-dye algorithm (black). For each of the two sets of simulations, we then generated a histogram of the expected distribution of slope values by randomizing the predictor variable, while maintaining its spatial autocorrelation. The vertical dashed lines represent the 2.5% and 97.5% thresholds of the randomizations. This figure is equivalent to Fig 1, but for geographic ranges that have been simulated to be causally linked to macroclimatic variables.

