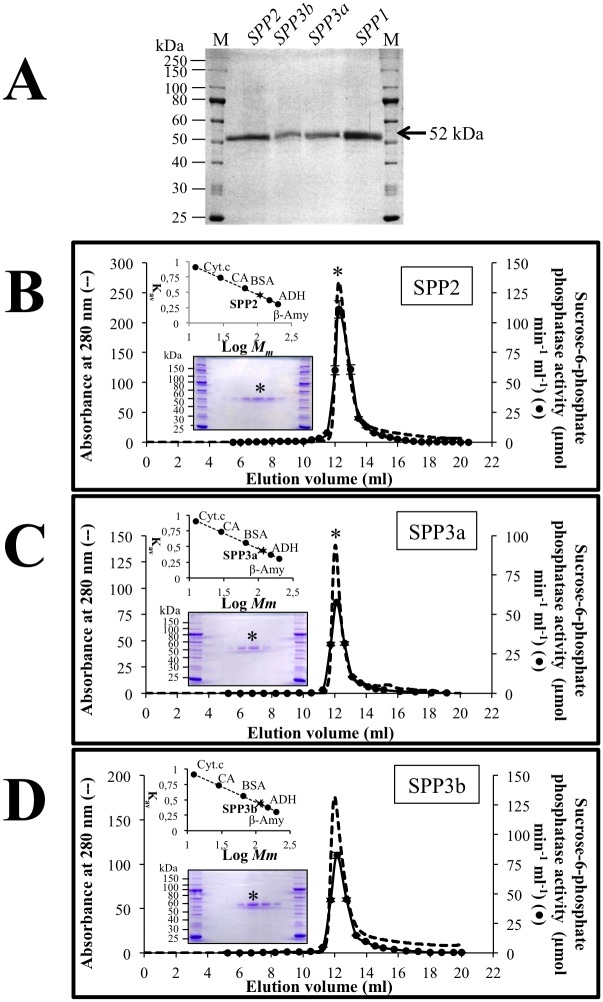
Fig 1. Purification and molecular mass determination of Arabidopsis SPP isoforms.
(A) SDS-PAGE analysis of purified SPP fractions after gel filtration (Superose 12 10/300 GL). In each case 4 μg of protein were loaded per lane. Purification folds were 306, 109 and 226 for SSP2, SPP3a and SPP3b, respectively. This parameter could not be estimated for SPP1 due to its lack of activity. Proteins were visualized by staining with Coomassie Blue R-250. Lane M, Molecular mass (kDa) markers. Elution profiles of recombinant Nt-Histag-SPP isoform SPP2 (B), SPP3a (C) and SPP3b (D), applied to a Superose 12 10/300 GL column. A calibration curve is displayed on the upper insert. Molecular mass standards: β-Amy, β-Amylase (200 kDa); ADH, alcohol dehydrogenase (150 kDa); BSA, bovine serum albumin (66 kDa); CA, carbonic anhydrase (29 kDa); and Cyt.c, cytochrome c (12.4 kDa). SDS-PAGE analysis of the fractions around the activity peaks (highest activity fraction marked with an asterisk) is displayed in the lower insert. As observed, both peaks, corresponding to absorbance at 280 nm (broken line) and sucrose-phosphate phosphatase activity (solid line), co-eluted.

