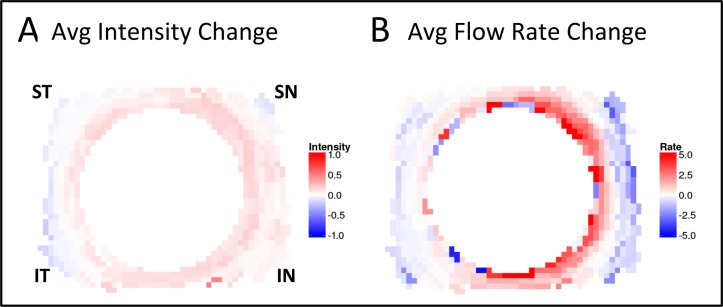
Figure 6.
(A) Quantitative change analysis after AIT. Each eye produces a pair of images: change in fluorescence intensity (left image) and change in rate of fluorescence uptake (right image). Red (positive values) indicates greater intensity or rate of uptake following AIT; blue (negative values) indicates less intensity or reduced uptake. (B) Summarizing graph of intensity and rate change for all six eyes.

