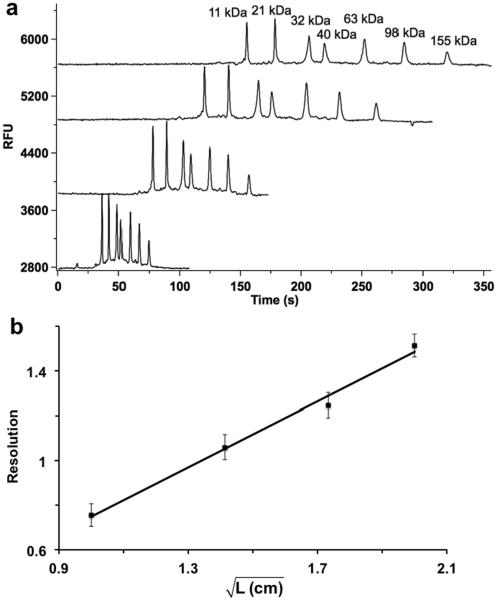
Figure 2.
Effect of channel length on resolution of protein ladder. A fluorescently labeled protein ladder consisting of 7 proteins from 11 to 155 kDa at a total concentration of 1 mg/mL protein was injected and separated using the chip in Figure 1 while monitoring fluorescence in the channels. (a) Traces, from top to bottom, are electropherograms recorded 1 cm, 2 cm, 3 cm, and 4 cm downstream of injection cross. RFU on the Y-axis stands for relative fluorescent unit. Overlaid electropherograms are offset in Y-axis. (b) Relationship between the square root of separation length (L) and resolution between 32 kDa and 40 kDa proteins. Separation field was 400 V/cm and sample was injected using gated injection method. 3 replicates at each separation length were recorded.

