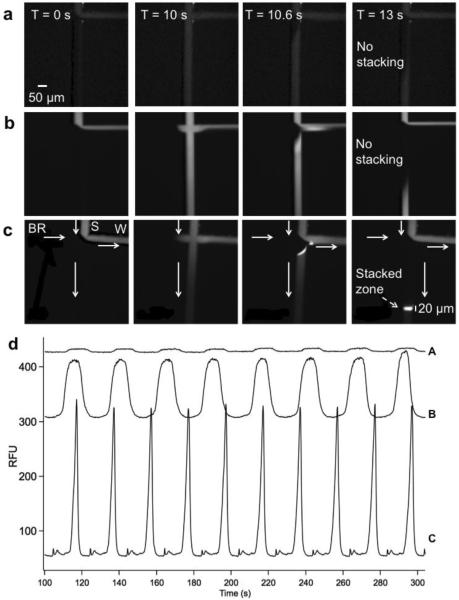
Figure 4.
Sample stacking effect on injection and separation. Each set (a,b, and c) has 4 images, representing before injection (T = 0 s), during injection (T = 10 s), and after injection (T = 10.6 s and T = 13 s). They show sequence of images at injection cross of chip similar to that in Figure 1 during 10 s long injection at 390 V/cm of 0.01 mg/mL FITC-BSA diluted 1:10 in (a) the same gel buffer used for separation; (b) water; and (c) 20 mM Na2HPO4 buffer. White arrows in (c) indicate the flow direction similar to that in Figure 1. Labels in (c) show the relative position of the sample (S), buffer reservoir (BR), and waste (W). The separation channel is oriented vertical. Comparison of images in (a) and (b) show concentration of FITC-BSA due to field amplification. Images in (c) show that the 600 μm long sample plug was focused into a 20 μm wide band within 3 s but not stacked in the other conditions. (d) Comparison of multiple injection zones measured 600 μm from the injection cross when sample was diluted in (A) gel, (B) water, and (C) 20 mM Na2HPO4 pH 7.5. Overlaid electropherograms are offset in Y-axis for clarity.

