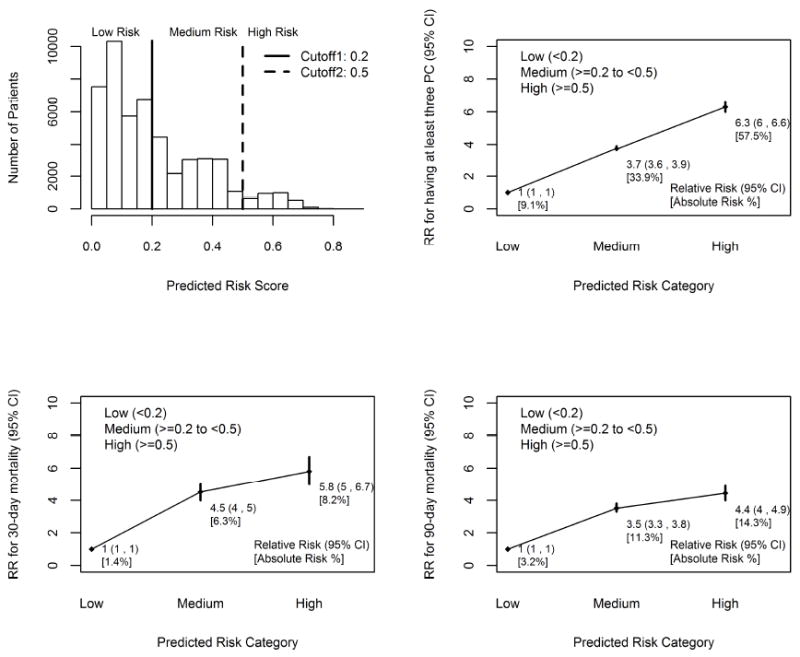
Figure 1.

Panel (A) Histogram of predicted risk scores with cut-offs to stratify patients into low, medium, and high risk groups for having at least three postoperative complications. (B) Relative risk and 95% confidence interval (CI) for having at least three postoperative complications. (C) Relative risk and 95% CI for 30-day mortality. (D) Relative risk and 95% CI for 90-day mortality.
Relative risks were obtained for medium and high risk categories with respect to low risk group. p<0.05 for comparison with respect to low risk group.
