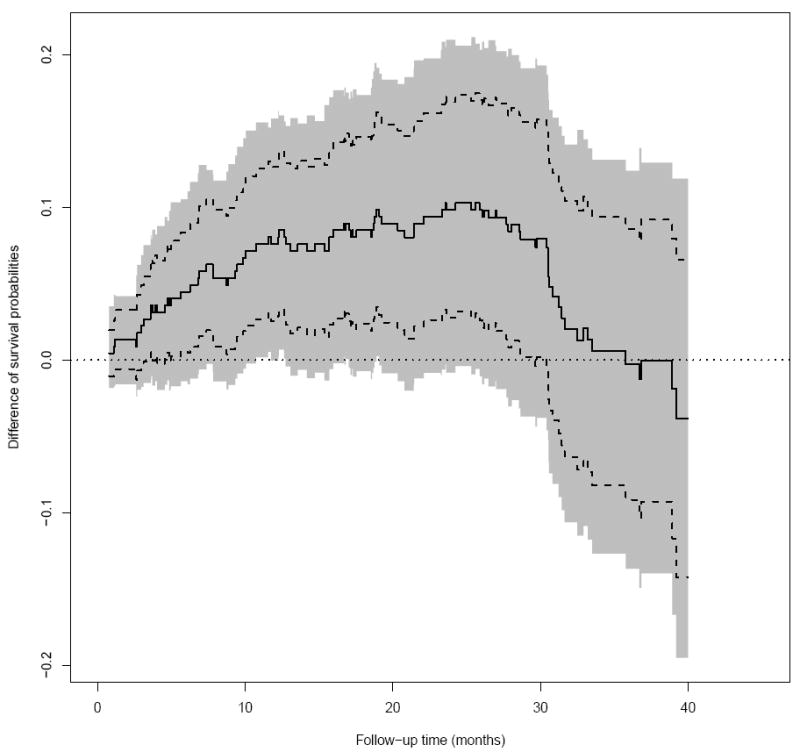
Figure 3.

The difference in survival probability at different time points between lowdose and high-dose groups of patients in the ECOG (E4A03) study (Solid: point estimate; Dashed: 0.95 pointwise confidence interval; Shaded: 0.95 simultaneous confidence interval; dotted: zero reference line).
