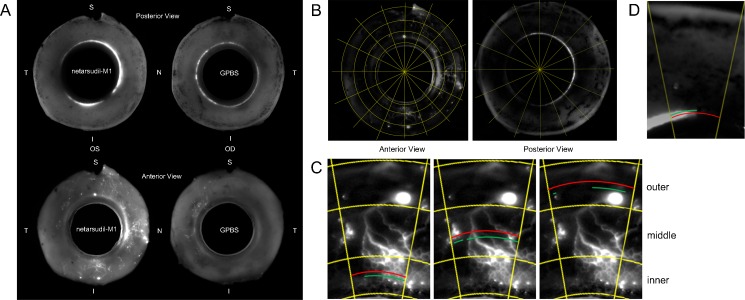
Figure 1.
Global image analysis. (A) Global images of anterior segments of perfused human eyes showing the outflow tracer patterns in the posterior (TM) and anterior (ESV) views (N, nasal; T, temporal; S, superior; I, inferior). (B) Each global image was digitally separated into 16 wedges after background subtraction. (C–D) Percentage effective filtration length was calculated in each wedge. The green lines represent total filtration length (TFL), and the red lines represent TSL. PEFL = ΣTFL/ΣTSL. In the anterior view global image (C), ESV PEFL of each wedge was calculated by averaging the PEFL measured at three locations: inner, middle, and outer. In the posterior view global image (D), TM PEFL was measured only in one location.

