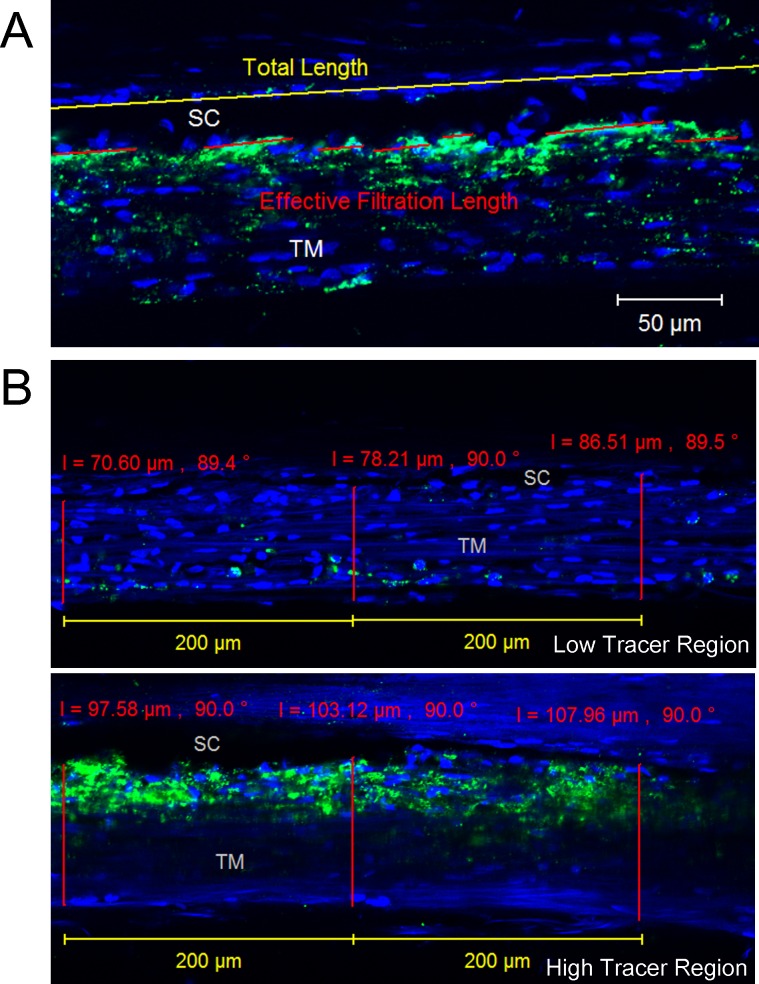
Figure 2.
Confocal image analysis. (A) Inner wall PEFL measurement. The red lines represent effective filtration length (FL), and the yellow line represents TL of the IW of SC. The green represents the tracer distribution, and the blue represents the nuclei. The average IW PEFL in each perfused human eye was calculated as IW PEFL = ΣFL/ΣTL. (B) Trabecular meshwork thickness measurement. The red line represents the thickness of TM from the innermost uveoscleral beam to the IW endothelium of SC, which was measured at every 200-μm length of IW. Low tracer and high tracer regions were determined by the tracer distribution shown in green.

