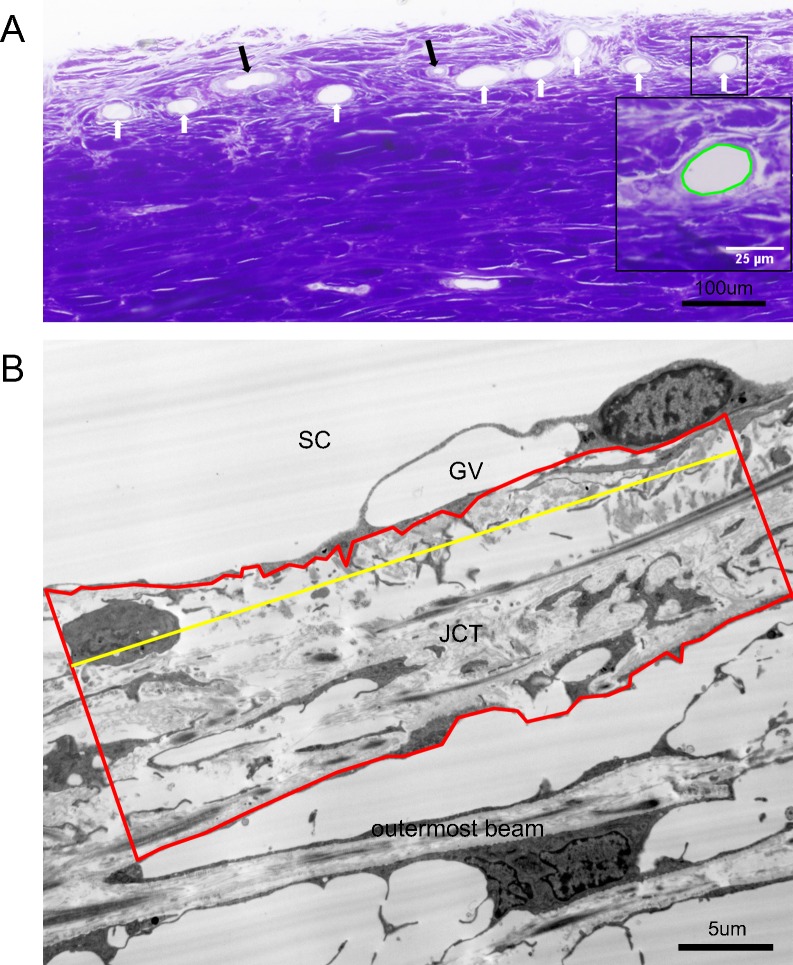
Figure 3.
Light and electron microscopic analyses. (A) Methods of ESV measurements. Cross-sections of ESVs (white arrows) and episcleral arteries (black arrows) were shown in a light microscopic image. The cross-sectional areas of ESVs were measured and calculated by ImageJ. The perimeter of the area measured is shown in green in the inset, which is a zoomed-in view of the squared area. (B) Methods of juxtacanalicular connective tissue thickness measurement. Juxtacanalicular connective tissue area (red) and JCT length (yellow) were measured in an electron microscopic image and the average JCT thickness (ΣJCT area/ΣJCT length) was then calculated accordingly. GV, giant vacuole.

