Figure 6.
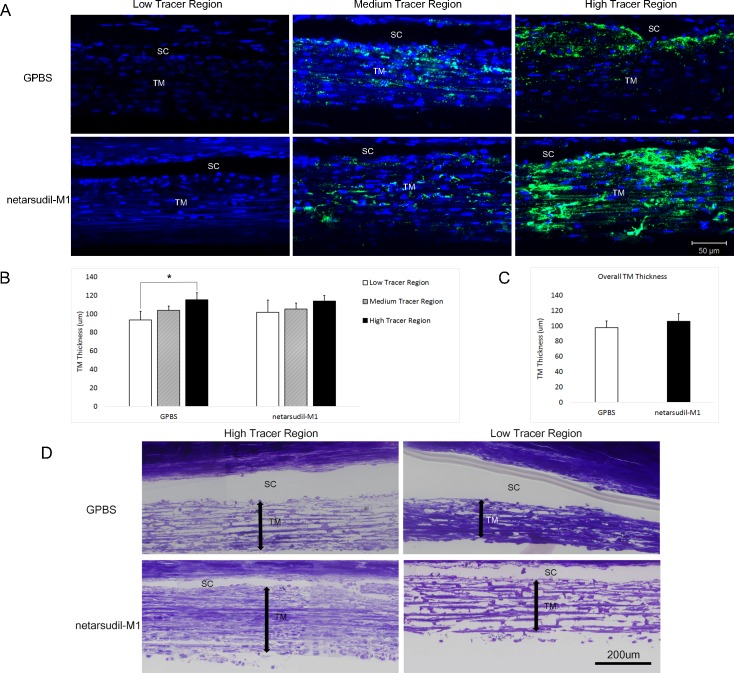
Trabecular meshwork thickness. (A) Representative confocal images of TM and SC are shown in low tracer, medium tracer, and high tracer regions of control (GPBS) and netarsudil-M1–treated eyes, respectively. The green represents the distribution of tracer. The blue represents the nuclei. (B) Trabecular meshwork thickness in high tracer regions was significantly higher than in low tracer regions in control eyes. However, there was no significant difference between low tracer and high tracer regions in netarsudil-M1–treated eyes (*P < 0.05) (n = 5). (C) The overall TM thickness was not significantly different between the netarsudil-M1–treated and control eyes. (D) Representative light microscopic images show the morphology in high tracer versus low tracer regions of control and treated eyes. Double arrows represent TM thickness. Trabecular meshwork structure was more expanded in high tracer regions than in low tracer regions in control eyes. More expanded TM was also observed in the low tracer regions of treated eyes when compared to controls.

