Figure 8.
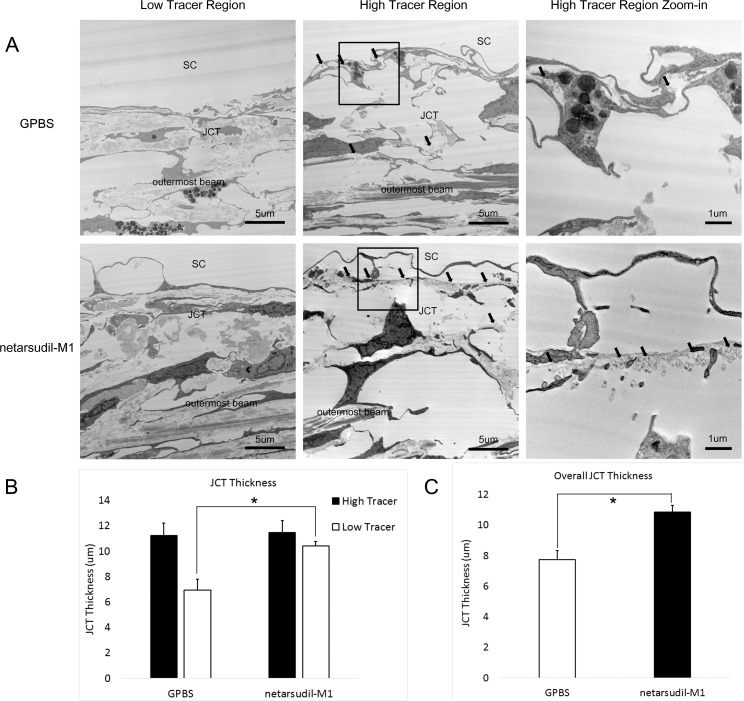
Juxtacanalicular connective tissue thickness. (A) Representative electron microscope images of JCT from low tracer and high tracer regions of GPBS control (top row) and netarsudil-M1–treated eyes (bottom row). Rightmost column presents a larger view of the squared region in middle column. The presence of tracers is indicated with black arrows. (B) A more expanded JCT was found in the high tracer regions than low tracer regions in control eyes. Netarsudil-M1 treatment induced a significant increase in the JCT thickness in low tracer regions compared to low tracer regions in control eyes (*P < 0.05) (n = 5). (C) The overall JCT thickness was increased in netarsudil-M1–treated eyes when compared to the controls (*P < 0.05) (n = 5).

