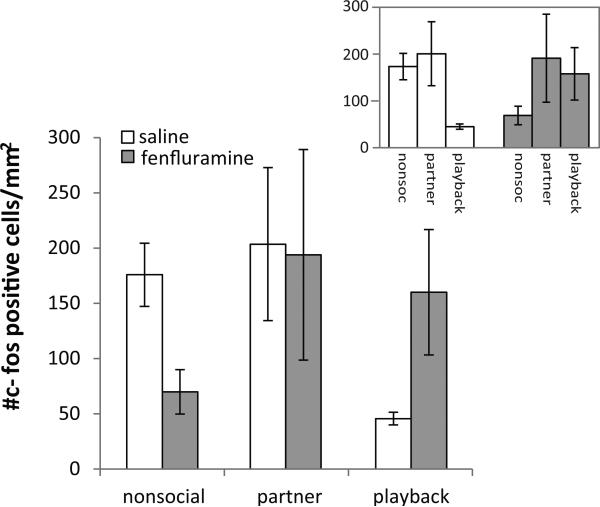
Figure 2.
The average density of c-fos positive cells in females treated with either fenfluramine or saline (control). There was a significant interaction between drug and social treatment (univariate GLM: F = 5.663, p = 0.009). Inset shows the same data re-arranged to highlight differences among social groups. Bars represent standard error of the mean.

