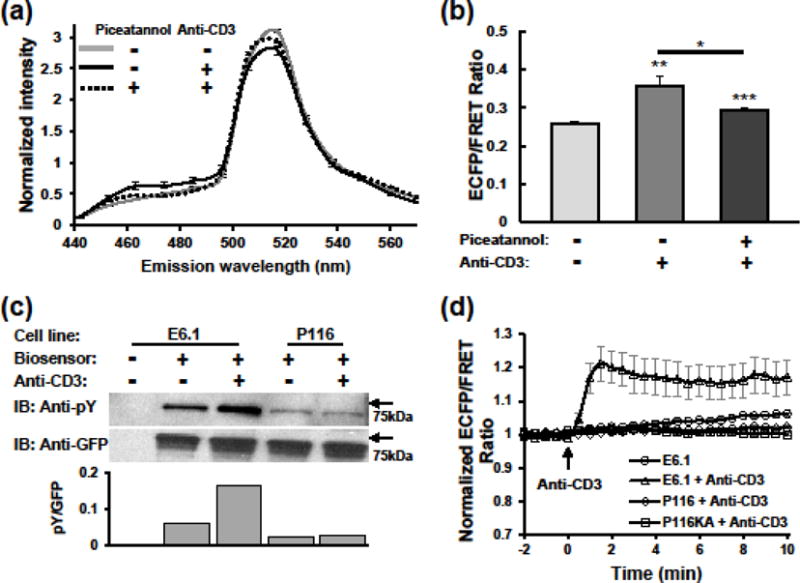
FIGURE 2. ZAP-70-specific biosensor responses in Jurkat T cells.

(a) Emission spectra of Jurkat E6.1 cells expressing the biosensor in response to anti-CD3 stimulation. E6.1 cells with or without piceatannol treatment were unstimulated or stimulated with anti-CD3 for 15 min. Spectral images of each cell were acquired using the lambda mode of an LSM510 META confocal microscope. Data represent mean ± SEM from 36, 40, and 73 cells of the three groups from top to bottom, respectively. (b) Statistics of 485 nm/517 nm emission ratios calculated from (a). Significance was assessed by Student t-test between the middle and right columns as well as between these two columns and the first one. *, p<0.05; **, p<0.01; ***, p<0.001. (c) Western blot analysis of biosensor phosphorylation in Jurkat cells. E6.1 and P116 cells expressing the biosensor were stimulated with anti-CD3 for 10 minutes. Cell lysate were subjected to anti-GFP immunoprecipitation, and analyzed by SDS-PAGE followed by immunoblotting with anti-phosphotyrosine (upper), and stripping and reblotting with anti-GFP (lower). Column plot shows quantification of pY to GFP ratio based on blots intensity. (d) Normalized ECFP/FRET ratio time courses of Jurkat E6.1 (n = 9 cells), P116 (n = 23 cells), and P116KA (n = 27 cells) cells expressing the biosensor in response to anti-CD3 (10 μg/ml) stimulation. Control shows background ratio changes in E6.1 cells without stimulation (n = 19 cells). Data represent mean ± SEM of individual cells imaged with Epi-fluorescence microscopy.
