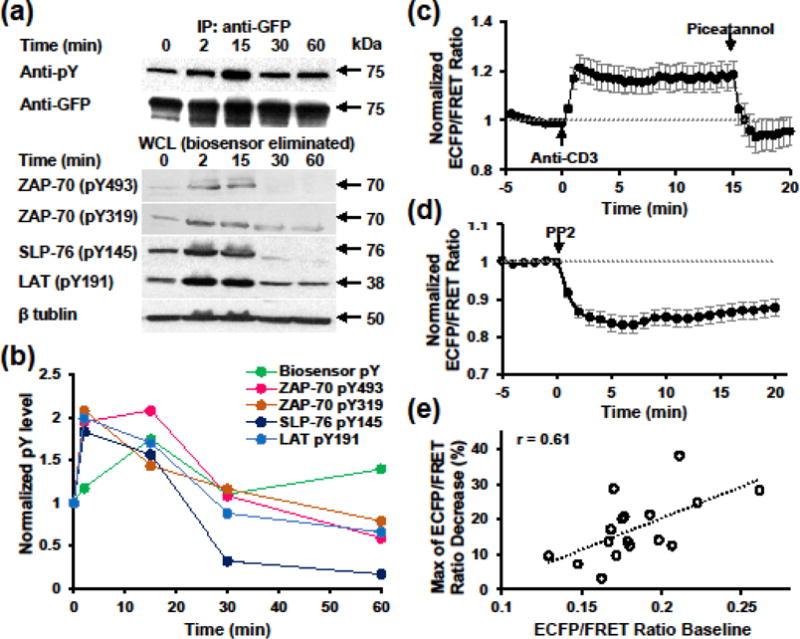
FIGURE 3. Biosensor reports ZAP-70 activities with fast kinetics in Jurkat T cells.

(a) Phosphorylation kinetics of the biosensor comparing with endogenous ZAP-70 and its substrate molecules upon stimulation with superantigen-pulsed Raji B cells. Upper, the whole cell lysates were subjected to immunoprecipitation with anti-GFP and subsequent blotting with either anti-pY or anti-GFP. Lower, whole cell lysates post biosensor immunoprecipitation were subjected to western blotting with antibodies indicated. (b) Quantification of phosphorylation kinetics using data shown in (a). pY band intensities were normalized by that of loading control and 0 min time point. (c)–(d) Normalized ECFP/FRET ratio time course (mean ± SEM) of Jurkat E6.1 cells expressing the biosensor in response to anti-CD3 (10 μg/ml) and subsequent piceatannol (10 μg/ml) stimulation (b, n = 9 cells) or PP2 (10 μM) stimulation (c, n = 17 cells). (e) Correlation analysis between ECFP/FRET ratio baseline and the maximum ratio decrease followed by PP2 treatment in (c).
