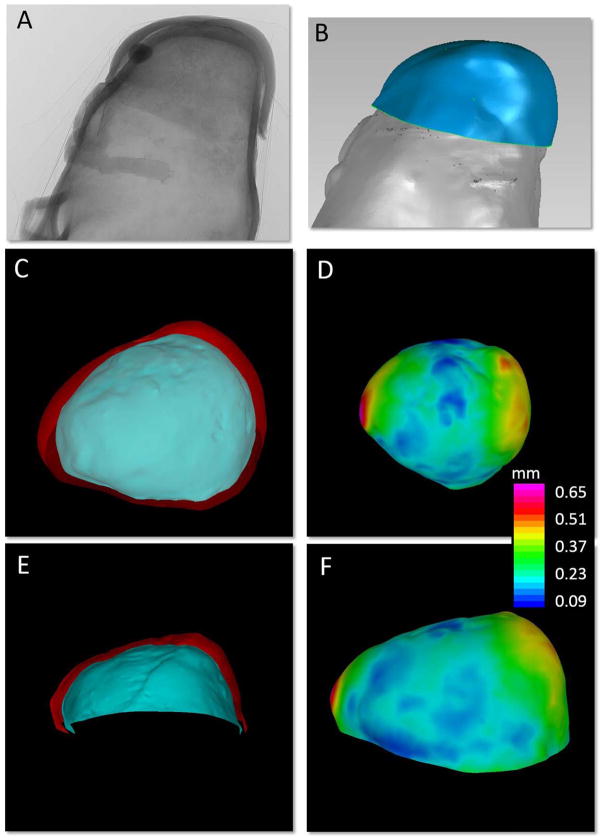
Figure 5.
Quantification of sample wall thickness. A) 2D projected micro-CT image of tissue sample mounted on 3D-printed aneurysm model, B) segmented virtual IA sample and virtual 3D-printed aneurysm, C, E) inner (blue) and outer (red) surfaces of the tissue sample, and D, F) contour map of wall thickness distribution, thickness computed as the distance map between the inner and outer surfaces of the virtual tissue sample.

