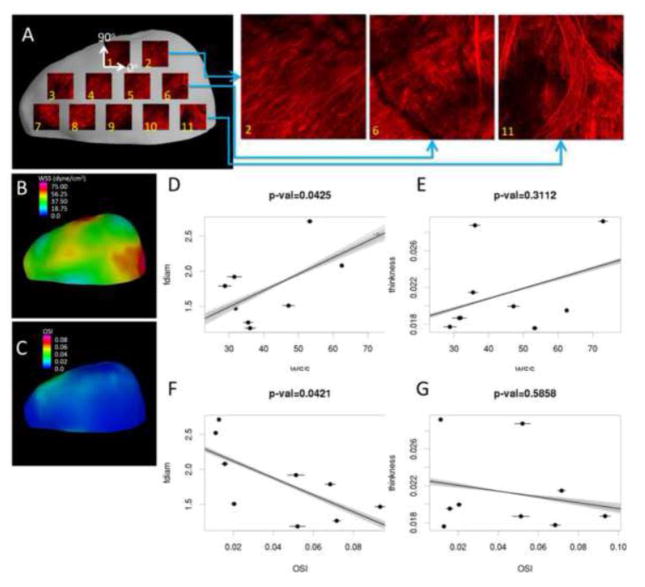
Figure 7.
Comparing collagen fiber diameter and wall thickness with mean WSS and OSI. Physical tissue sample is MPM imaged in a grid pattern and results are mapped back to virtual tissue sample (A). WSS and OSI results are mapped to the virtual tissue sample reconstruction (B, E). Mean WSS and OSI are plotted against mean fiber diameter and wall thickness for each region (C, D, E, and F). Error bars indicate variability of hemodynamic parameters with respect to different tissue alignments. Lines illustrate variability of linear regressions for different tissue sample alignments.

