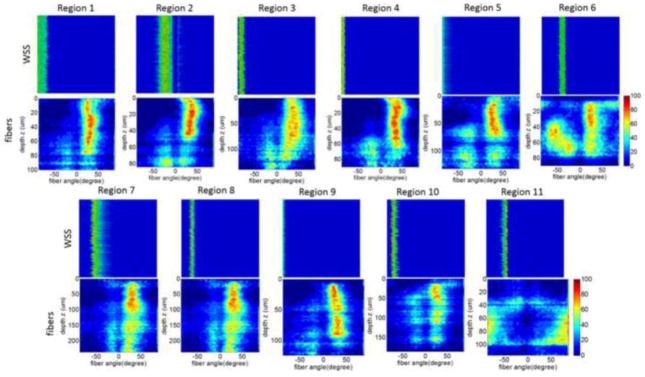
Figure 8.
Comparing collagen fiber orientation with WSS orientation at selected regions of the dome as in Figure 7. Fiber orientation histograms for different depths (vertical axis) are presented as colormaps for each region of the tissue sample (bottom row). Colormaps of orientation of WSS vector for different sample alignments (vertical axis) next to the fiber orientations for each region.

