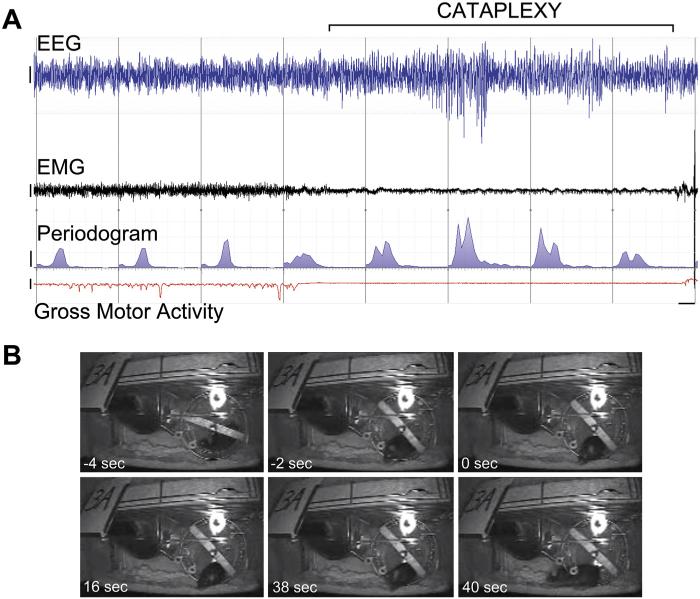
Fig. 2.
Electrophysiological and behavioral indices of cataplexy in a representative DTA mouse at 9 weeks DOX(−). (A) 80 s recording (demarcated in 10 s epochs by vertical lines) shows ~40 s cataplexy episode (bracket) and prior wakefulness with wheel-running activity revealed by EEG (blue), EMG (black), EEG periodogram (blue area under curve, 0–25 Hz), and gross motor activity (red, as inferred by telemetry unit signal strength). (B) Frames from video in the seconds before cataplexy onset, at onset and during the bout of cataplexy, and 2 s after cataplexy termination. Bars = 200 μV (EEG and EMG), 200 μV2 (EEG periodogram), and 5 arbitrary units (signal strength measure of gross motor activity).

