
FIGURE 3.
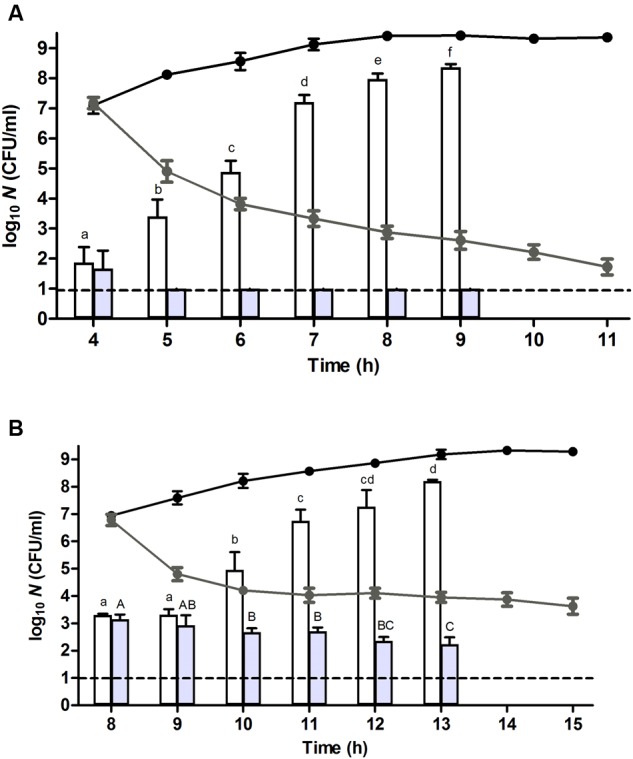
Resuscitation, heat resistance, and ampicillin sensitivity of a (A) unstressed control cells and (B) heat stressed (56°C, 15 min, in 0.85% KCl) survivors of an E. coli ATCC 43888 population after reaching ca. 107 CFU/ml (i.e., at t = 4 and 8 h for control and heat treated population, respectively) during incubation in TSB (37°C) at indicated time points. Black and gray line graphs represent the evolution of viability on TSA of the corresponding populations in the absence or presence of ampicillin (100 μg/ml), respectively. White and gray bars represent the number of survivors determined on TSA of the corresponding populations in the absence or presence of ampicillin (100 μg/ml), respectively, subjected to a heat shock (53°C, 15 min) in 0.85% KCl. Viability is expressed as log10(CFU/ml) on the indicated plating medium, and the dotted line represents the detection limit of 10 CFU/ml. Lowercase and capital letters indicate statistically significant differences (P ≤ 0.05) in the survival of the corresponding populations in the absence or presence of ampicillin, respectively, to the second heat shock (53°C) among different sampling times.