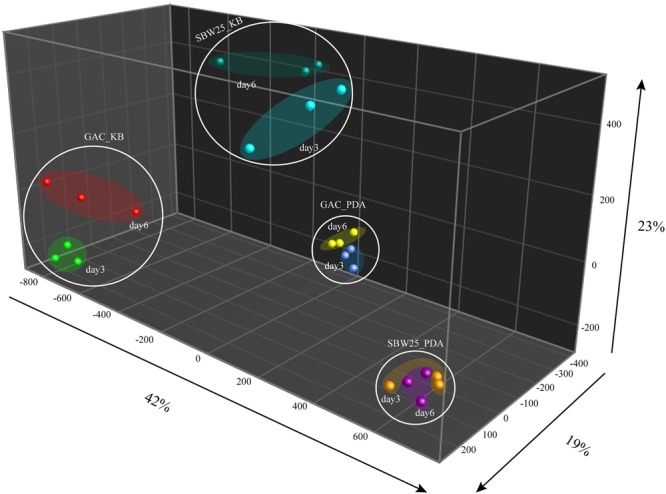
FIGURE 1.

Discriminant function analysis based on 79 volatile organic compounds (VOCs) that were significantly different in their abundance at least under one of the conditions analyzed (ANOVA, P < 0.05). The first component explained 42% of the total variation that is primarily associated to variation in the abundance of VOCs when Pf.SBW25 and the Gac-mutant are grown in 1/5th PDA and KB media. The second component explained 23% of the total variation and particularly related to the effect of the mutation on VOCs when Pf.SBW25 and the Gac-mutant are grown on KB medium. The third component explained 19% of the total variation and is related to the effect of the Gac-mutation on the VOCs when Pf.SBW25 and the Gac-mutant are grown on 1/5th PDA.
