
FIGURE 2.
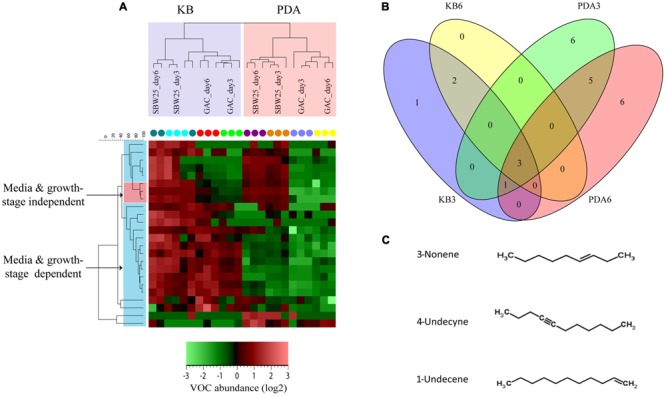
VOCs profiling of Pf.SBW25 and the gacS-mutant (Gac-mutant). (A) Hierarchical cluster analysis (HCA) based on 24 VOCs that were significantly different (P < 0.05 and fold change > 2) for the Pf.SBW25 and the Gac-mutant grown on 1/5th PDA and KB media after 3 and 6 days of inoculation. Columns represent the different isolates (in triplicates), whereas rows represent the VOCs (green: low abundance, red: high abundance). (B) Venn diagram showing the unique and shared VOCs detected for Pf.SBW25 and the Gac-mutant grown on 1/5th PDA and KB media after 3 (D3) and 6 (D6) days of inoculation. Yellow and blue cycles represent VOCs detected for strains grown on KB at D3 and D6, respectively; Green and red cycles represent VOCs detected for strains grown on 1/5th PDA at D3 and D6, respectively. (C) Group of alkenes significantly affected by the Gac-mutation of Pf.SBW25 grown on KB and 1/5th PDA media at D3 and D6 after inoculation.