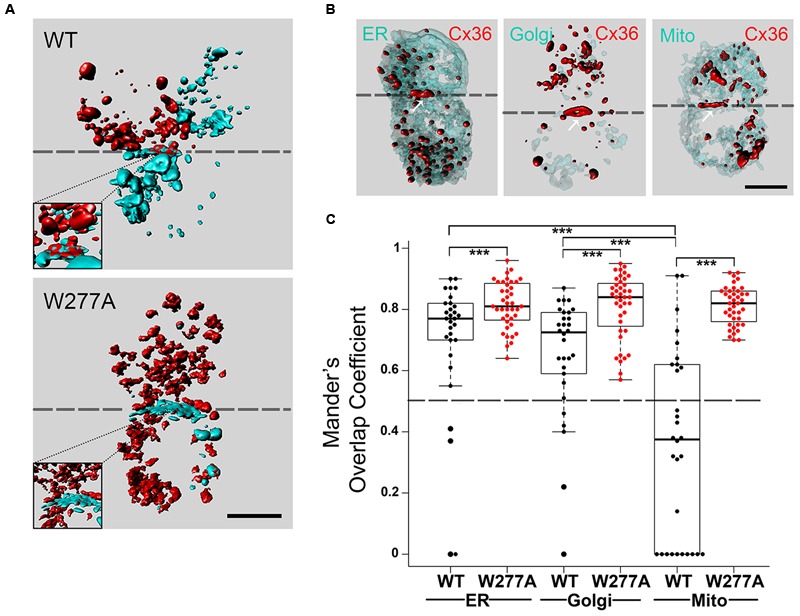
FIGURE 2.

Colocalization of Cx36 with organelle markers indicating interaction occurring as early as at the endoplasmic reticulum. (A) Representative 3D images of Neuro2A cells expressing wild-type Cx36 or the W277A mutant. Note that cell pairs derived from single independent transfections tagging the proteins of interest with EGFP or DsRed monomer. The increased presentation of mixed red and turquoise vesicles in W277A transfected cell pairs suggests reduced GJP stability and increased protein turnover. Insets represent magnifications of the GJP region. (B) Neuro2a cells expressing wild-type Cx36–ECFP (in red) and DsRed monomer tagged organelle markers (endoplasmic reticulum, Golgi apparatus, and mitochondria, in light turquoise). The localization of Cx36 plaques is indicated with white arrows. (C) Mander’s overlap coefficients calculated with the ZEN 2010 program for Cx36 WT (n = 30) and W277A (n = 40) with the different organelle markers are shown with error bars indicating the maximum and minimum range. 3D images in (A,B) were created with Bitplane Imaris 7.6.4. Scale bars in (A,B): 10 μm. Error bars box plot: maximum and minimum range with median; Mann–Whitney U test, ∗∗∗p < 0.01.
