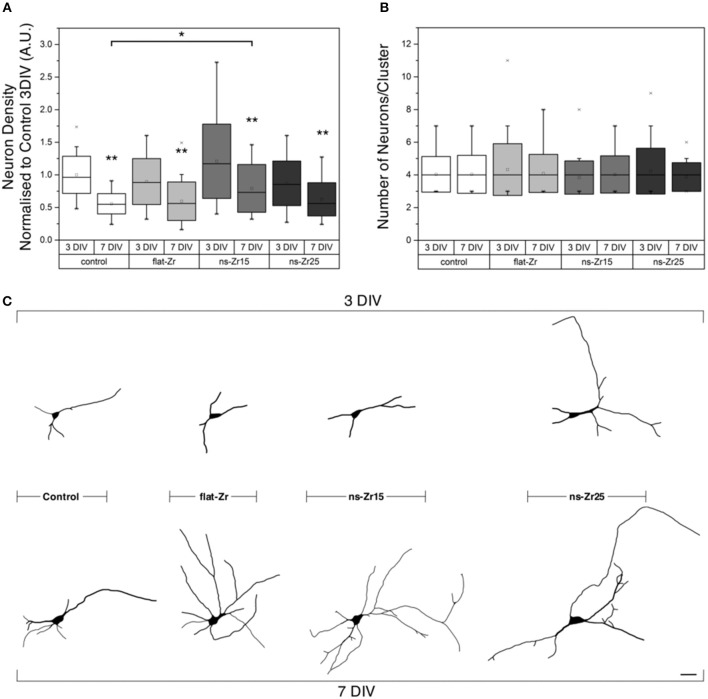
Figure 2.
Neuron density/viability, clustering, and neuronal morphology after interaction with the different surface topographies. (A,B) Quantifications of the (A) number of neurons (normalized to Control 3 DIV) and (B) cell clustering of neuron populations grown on the different substrates were derived from NeuN staining and are represented in the boxplots and were derived from 3 individual experiments with total number of 355–651 analyzed cells (see methods for details). Images illustrating the appearance of typical neuron populations can be found in Figures 3A–H. (C) The graphics show representative examples of the neuronal morphology reconstruction (visualization obtained by lentiviral transduction with eGFP-VAMP2, details in the Methods). The scale bar represents 10 μm.

