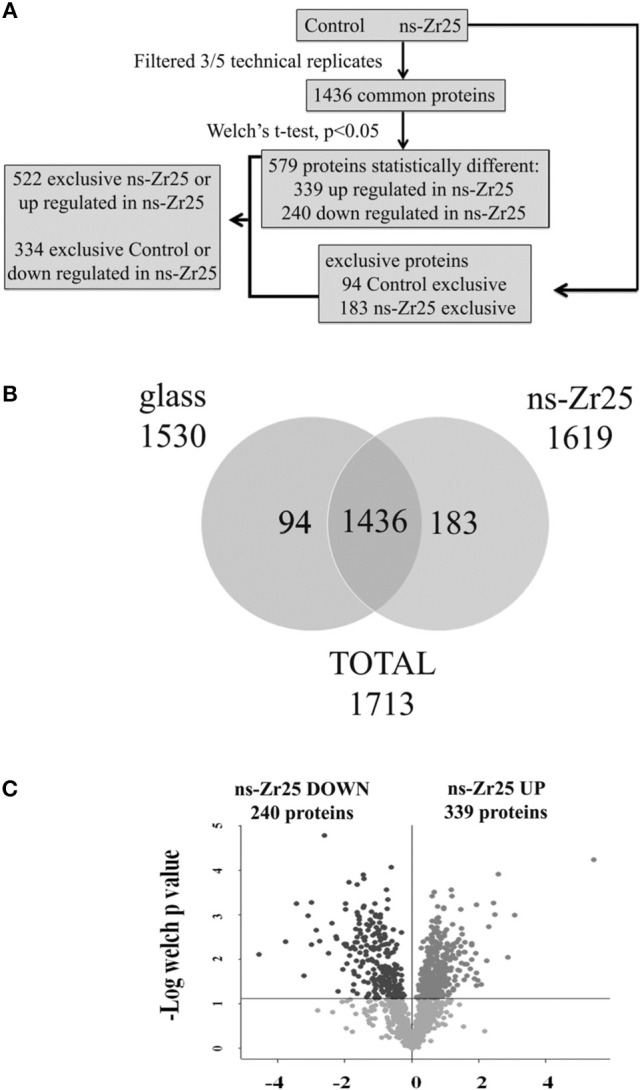
Figure 4.

Proteomic workflow and analysis for the comparison between ns-Zr25 and Control. (A) Work flow of the proteomic approach. A shotgun proteomic analysis was performed on the hippocampal neurons cultured for 3 days either in the Control condition or on the nanostructured zirconia surface with a roughness Rq of 25 nm rms. Statistical analyses were performed using the Perseus software (version 1.4.0.6, www.biochem.mpg.de/mann/tools/). (B) Venn diagram of the comparison between cells grown on ns-Zr25 and in the Control condition. Only proteins present and quantified in at least 3 out of 5 technical repeats were considered as positively identified in a sample and used for statistical analyses. (C) Vulcano plot of the proteins differentially expressed. Proteins were considered differentially expressed if they were present only in ns-Zr25 or Control or showed significant t-test difference (cut-off at 5% permutation-based False Discovery Rate). The data points that are above the p-value line (t-test value cut off = 0.0167) in the volcano plot represent the proteins that were found to be differentially expressed in these two conditions upon treatment with large magnitude fold changes and high statistical significance: In dark gray the proteins downregulated, in light gray the upregulated.
