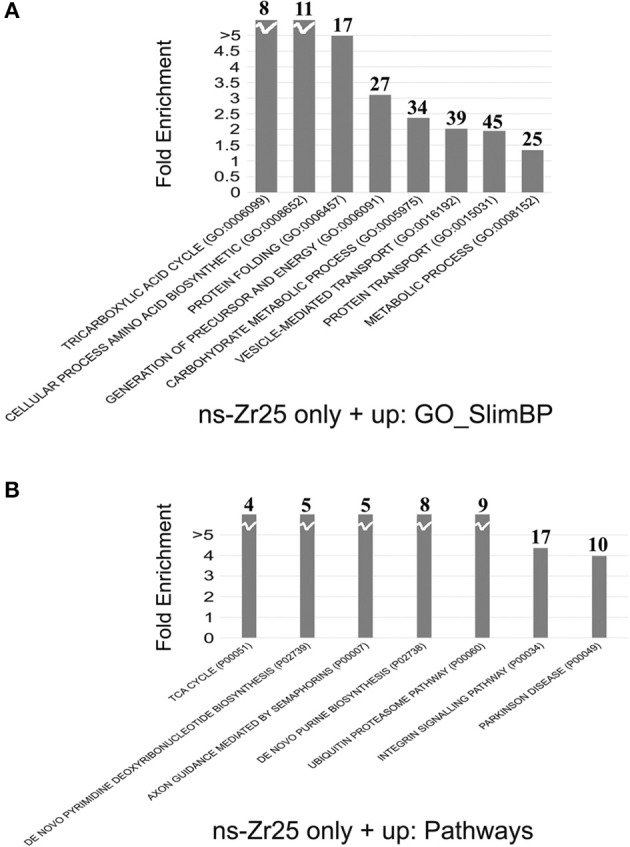
Figure 5.

Gene annotation enrichment analysis for the comparison between ns-Zr25 and Control. (A,B) The analysis was carried out on proteins upregulated or expressed only in ns-Zr25. The proteins differently expressed were clustered according to their functions using the Panther platform (Version 10.0 release date April 25, 2015) filtered for significant Gene Ontology terms: (A) Biological Process (GO-SlimBP) and (B) pathways using a p value < 0.05. The fold enrichment value is reported in the y-axis. The numbers in bold above each bar indicates the number of genes enriched in the analysis.
