
FIGURE 6.
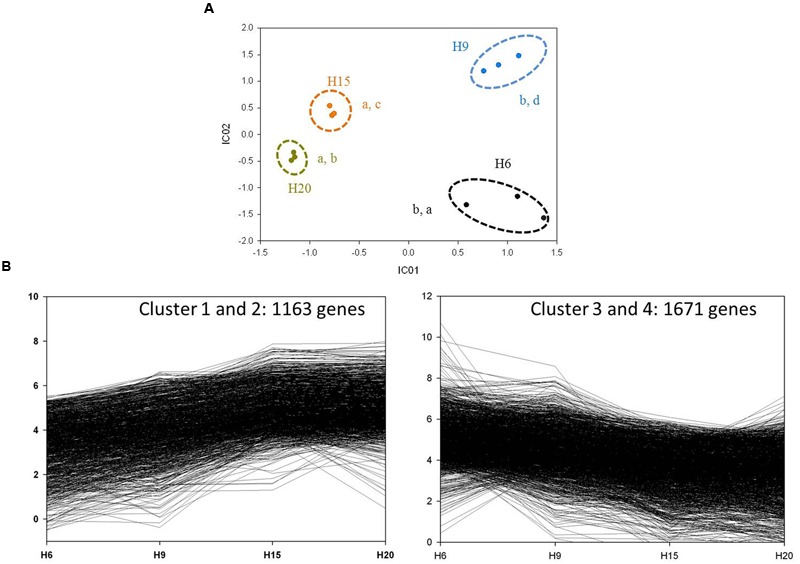
General analysis of H6, H9, H15, and H20 transcriptomes. (A) ICA of H6 (black dots), H9 (blue dots), H15 (orange dots), and H20 (dark yellow dots). Variance explained by the two independent components: 89.36%. The three biological replicates of each time point are surrounded by a dotted line. Letters correspond to homogeneous groups determined by the Tukey post hoc test on IC1 and IC2 coordinates, respectively. (B) Clusters with up-regulated and down-regulated genes through the time-points.