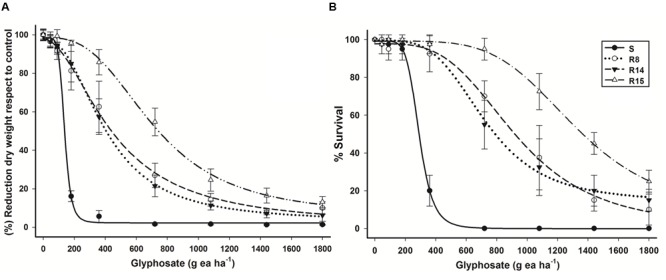
FIGURE 1.

Log–logistic curves of glyphosate-susceptible and -resistant L. virgata populations evaluated at 21 DAT. (A) Dose–response curve with respect to percentage of dry mass reduction. (B) Dose–response curve with respect to percentage of survival. Vertical bars represent the standard error of the mean (n = 10).
