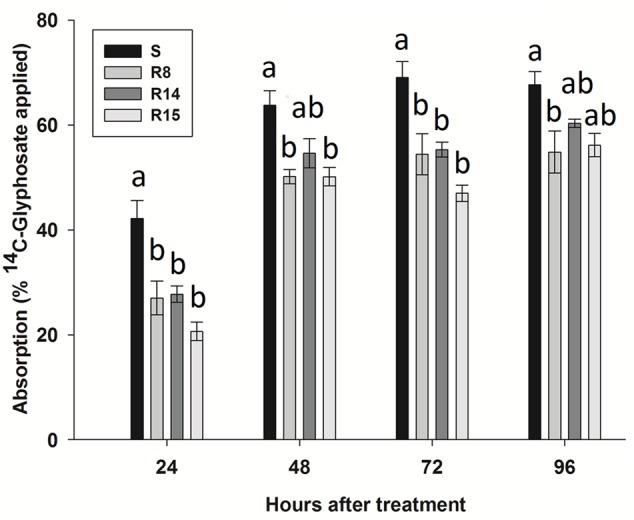
FIGURE 3.

14C-glyphosate absorption in glyphosate-susceptible and -resistant plants of the L. virgata populations. Different letter at each evaluation time is statistically different at 95% probability determined by the Tukey’s test. Vertical bars represent the standard error of the mean (n = 5).
