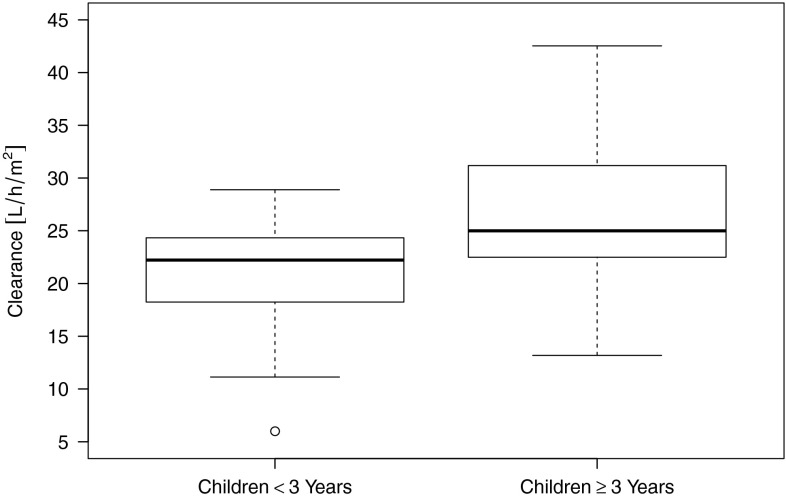
Fig. 3.
Age dependency of doxorubicin clearance. Distribution of clearance (CL) (normalized to BSA) for the two investigated age groups (A: <3 years and B: 3 to <18 years). Data are summarized as box-and-whisker plots. In each plot, the central box represents values from the lower to upper quartile (25–75 percentiles) and the middle line the median. The end of the upper whisker corresponds to the largest observation smaller than the 75 % quantile + 2*IQR. Likewise, the end of the lower whisker corresponds to the smallest observation larger than the 25 % quantile − 2*IQR. Observations that are beyond the whiskers can be regarded as outliers

