
Figure 4.
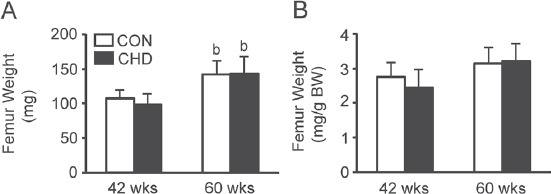
Femur weights (A) and relative weights (B) of the control (CON) and collagen hydrolysate (CHD) groups at 42 and 60 weeks of age. Values are means ± SD for 5 animals. BW, body weight. bP<0.05 compared with the CHD group at 42 weeks of age.
Official websites use .gov
A
.gov website belongs to an official
government organization in the United States.
Secure .gov websites use HTTPS
A lock (
) or https:// means you've safely
connected to the .gov website. Share sensitive
information only on official, secure websites.
Femur weights (A) and relative weights (B) of the control (CON) and collagen hydrolysate (CHD) groups at 42 and 60 weeks of age. Values are means ± SD for 5 animals. BW, body weight. bP<0.05 compared with the CHD group at 42 weeks of age.