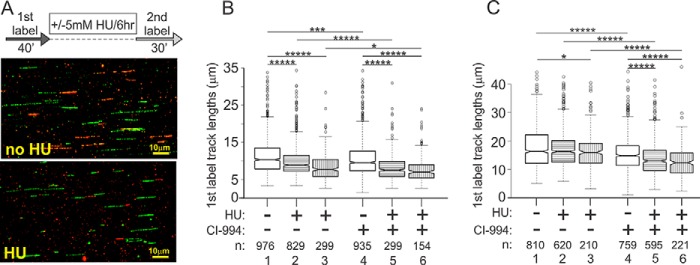
FIGURE 10.
CI-994 treatment enhances nascent strand truncation. A, a labeling scheme for maRTA analysis of nascent strand truncation and examples of tracks seen in UW289.B1 BRCA1-deficient ovarian carcinoma cells. Pulses of 1st label (IdU) and 2nd label (EdU) are separated by a 6-h interval with no label and either with or without 5 mm HU. Nascent strand truncation is revealed as shortening of 1st label tracks upon incubation with HU. B, quantitation of 1st label track lengths from two experimental replicas performed with UW289.B1 cells as depicted in A. CI-994 was added at 3 μm overnight before and during the experiments. Significance was measured in Wilcoxon tests, and p value designations are as in Figs. 3, 7, and 8, i.e. *, p ≤ 5 × 10⁻²; **, p ≤ 5 × 10⁻³; etc. Box fill: white, 1st label tracks in untreated cells; horizontal stripes, 1st label-only tracks (inactivated forks); vertical stripes, 1st label segments of two-label tracks (reactivated forks). Note that without HU (white boxes), the absolute majority of tracks are either 1st label- or 2nd label-only, although they can belong to either ongoing or inactivated forks. C, quantitation of 1st label track lengths from two experimental replicas performed with primary human fibroblasts as depicted in A. Designations and statistics are as in B. CI-994 was added at 6 μm overnight before and during the experiments.

