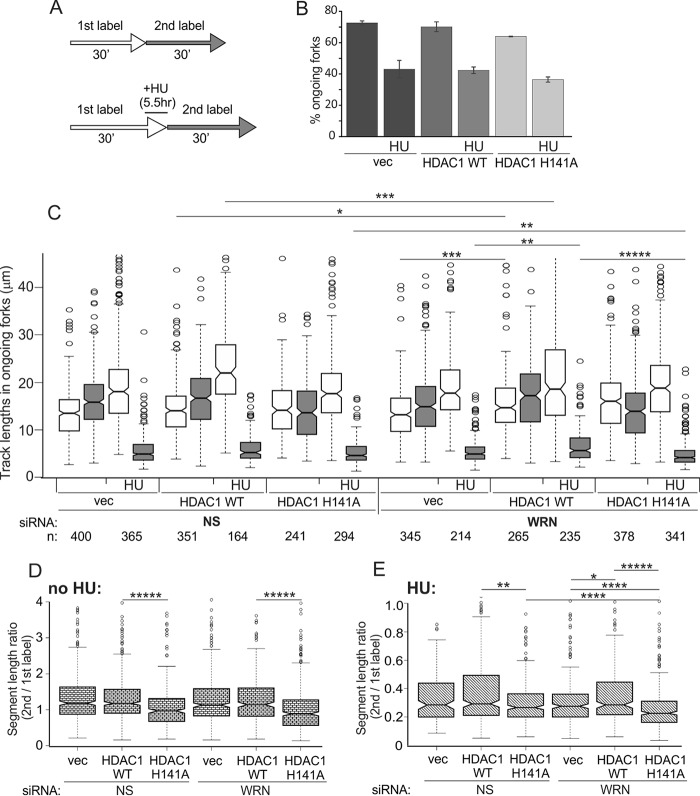
FIGURE 7.
H141A mutant of HDAC1 shows a distinct phenotype of replication fork progression. A, a labeling scheme for maRTA. HU was used at 4 mm, and 1st and 2nd labels were CldU and IdU, respectively. B, percentages of ongoing forks in WRN-depleted untreated and HU-treated (HU) HDAC1 KO RD cells (clone #4) expressing the indicated HDAC1 transgenes or empty vector (vec). The bar graph shows average values derived from two experimental replicates, and error bars are S.D. C, lengths of 1st label (white) and 2nd label (gray) segments in two-label tracks of ongoing forks were box-plotted to evaluate fork progression. The length distribution data were derived from two experimental replicas. Statistical significance was calculated in Wilcoxon tests, and p value designations are as in Fig. 3D. NS, nonspecific. D and E, ratios of the 2nd to 1st label segment lengths in each ongoing fork in untreated (D) and HU-treated (E) cells were box-plotted to evaluate consistency of fork progression. The data used are from the set shown in C. In C–E the statistically significant differences are marked with asterisks standing for p values. p value designations are as in Fig. 3D, and all p values of the orders of magnitude at or below 5 × 10−06 are labeled as *****. Numbers of tracks analyzed are shown below the graph.

