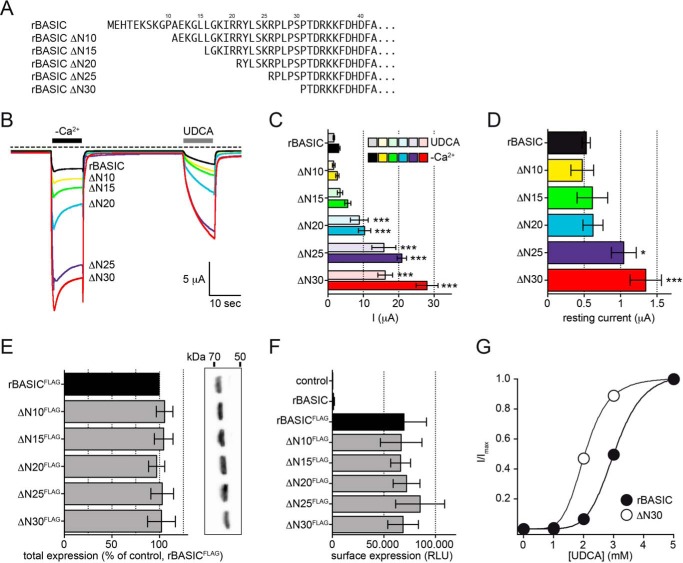
FIGURE 2.
Successive truncation of the N-terminal domain increases the activity of rBASIC. A, representation of the N-terminal sequences of WT rBASIC and the respective truncations. B, representative current traces illustrating the activation of WT rBASIC, rBASIC ΔN10, ΔN15, ΔN20, ΔN25, and ΔN30 by the removal of extracellular divalent cations (−Ca2+) and application of 2 mm UDCA. C, quantitative comparison of current amplitudes induced by the removal of divalent cations (−Ca2+, solid bars) or application of 2 mm UDCA (transparent bars) as shown in B). Error bars, S.E., n = 12, ***, p < 0.001 (ANOVA). D, quantitative comparison of the resting current amplitudes before divalent free activation as shown in B. Error bars, S.E., n = 12, *, p < 0.05; ***, p < 0.001 (ANOVA). E, expression levels of WT rBASICFLAG and the respective truncations as determined by Western blotting. Left, quantitative analysis of Western blotting results (n = 5); band intensities were determined using the software BioChem (Vilber Lourmat, Eberhardzell, Germany) and normalized against rBASICFLAG. Right, representative Western blot. No significant differences between WT rBASIC and the respective truncations were identified (ANOVA). F, surface expression levels of WT rBASICFLAG and the respective truncations as determined by oocyte luminescence assay. Uninjected oocytes and control oocytes expressing rBASIC without FLAG epitope served as controls. No significant differences between WT rBASIC and the truncations were observed (ANOVA). G, concentration-response curve for UDCA for WT rBASIC (closed circles) and rBASIC ΔN30 (open circles). Currents were normalized to the maximum current in the presence of 5 mm UDCA, which were 30.4 ± 5.9 μA for WT rBASIC and 57.8 ± 7.2 μA for rBASIC ΔN30. Error bars, S.E., curves were fitted to the Hill equation (n = 8).

