FIGURE 6.
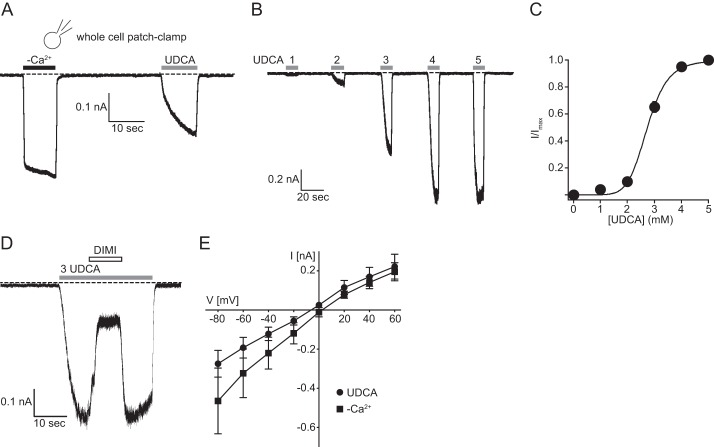
Whole cell patch clamp recordings from HEK293 cells expressing rBASIC. A, representative current trace illustrating the activation of rBASIC expressed in HEK293 cells by the removal of extracellular divalent cations (−Ca2+) or by the application of 2 mm UDCA. B, representative current trace illustrating the concentration-dependent activation of rBASIC by UDCA. C, concentration-response curve for UDCA. Currents were normalized to the maximum current in the presence of 5 mm UDCA, which was 1.27 ± 0.25 nA. Error bars, S.E., curves were fitted to the Hill equation (n = 8). D, representative current trace illustrating the diminazene-dependent inhibition (10 μm diminazene) of rBASIC activated by 3 mm UDCA. E, mean current-voltage relationships of rBASIC in the absence of extracellular divalent cations (squares) or in the presence of UDCA (circles). The holding potential was increased stepwise from −80 to +60 mV in 20-mV steps. Error bars, S.E.; n = 8.

