FIGURE 9.

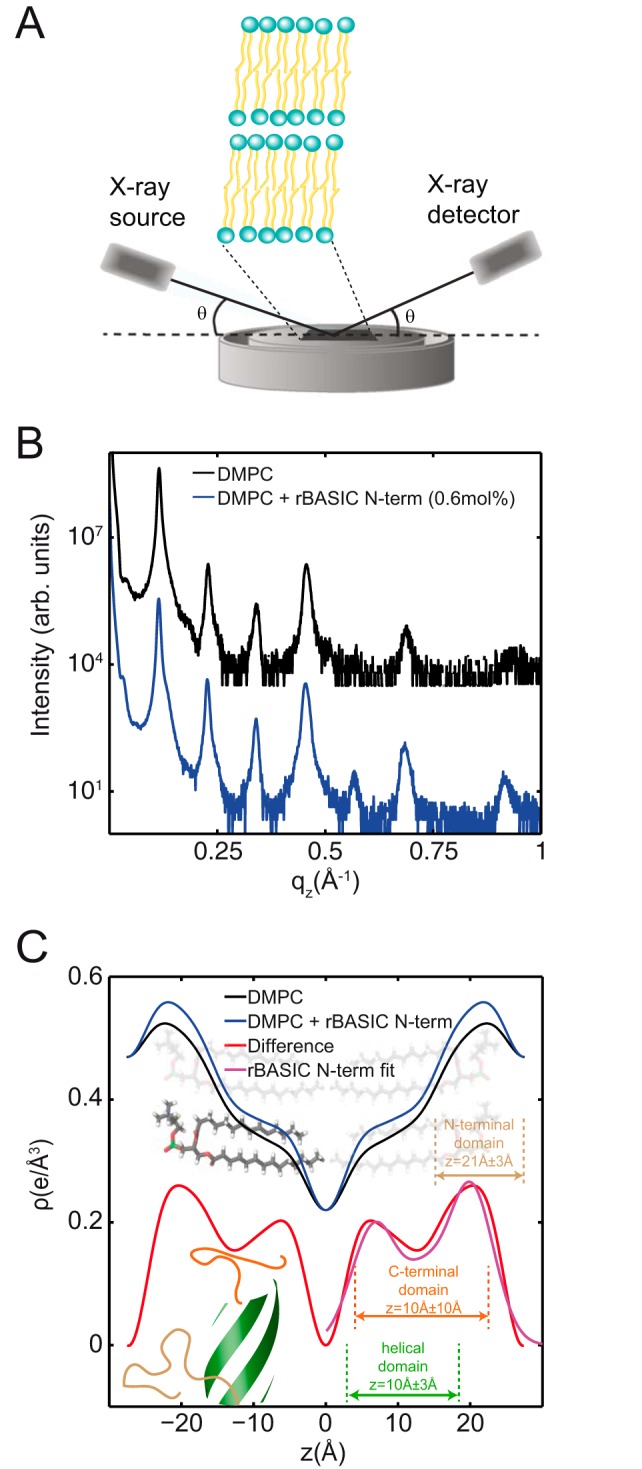
X-ray diffraction of synthetic membranes containing the N-terminal domain locate the peptide fragment within the membrane in a helical configuration. A, schematic of the experimental setup. The atomistic structure of oriented lipid bilayers was studied using X-ray diffraction in supported, highly aligned lipid membranes. B, out-of-plane diffraction measured from membrane complexes with and without the peptide fragment, rBASIC N-term. C, electron density profiles for each membrane complex, calculated by Fourier transformation of the Bragg peaks. The schematic lipids highlight the meaning of the features in the density profile: the peak at z ∼21 Å represents the electron-rich headgroup, although the bilayer center is between the tails of two lipid leaflets. The density of the peptide was calculated from ρrBASIC N-term(z) = ρrBASIC N-term + membrane(z), − ρmembrane(z) and is shown in the red curve. The electron density for a model of the peptide configuration and position is shown by the magenta curve.
