FIGURE 1.
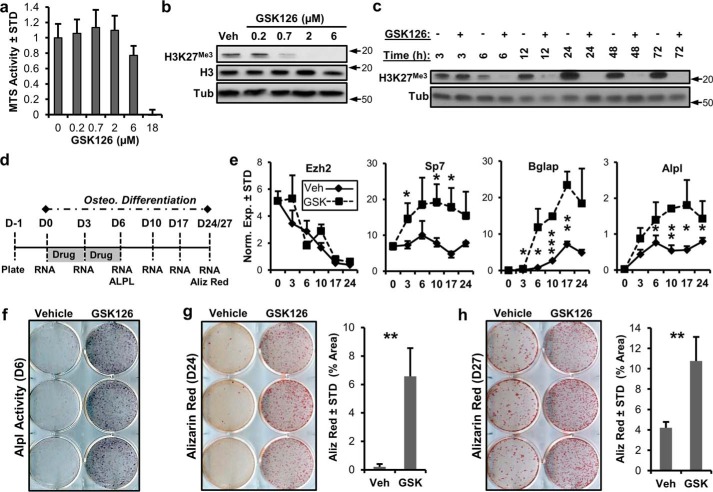
Ezh2 inhibition accelerates osteoblastic differentiation of MC3T3 cells. a, MTS toxicity assay of GSK126-treated MC3T3 cells for 3 days (n = 3) showing that 2 μm GSK126 does not affect total cellular metabolic activity. b and c, Western blotting showing dose-dependent (b) and time-dependent (c) modulation of H3K27me3 by GSK126 in MC3T3 cells. The results indicate rapid loss of H3K27me3 at a concentration of 2 μm GSK126 by 6 h in MC3T3 cells. The cells were treated with different concentrations of GSK126 1 day after plating and harvested 3 days later (b) or treated with 2 μm GSK126, with the protein lysates collected at the specified times (c). Arrows indicate molecular mass marker (kDa) location. d, diagram of the experimental protocol for treatment of MC3T3 cells with GSK126 (5 μm) shown in e–h. e–h, RT-qPCR of Ezh2 and osteogenic markers (n = 3) (e), alkaline phosphatase staining (f), and alizarin (Aliz) red staining (g and h) for MC3T3 cells treated with vehicle or GSK126. Alizarin red staining was quantified by ImageJ software. The experiments were repeated three times, and biological triplicates (means ± S.D.) are shown when applicable. We note that it is possible to detect appreciable residual H3K27me3 levels upon longer exposures in Western blots of cells treated with GSK126, indicating that inhibition is not absolute. Tub, tubulin; Veh, vehicle; Osteo., osteoblastic; STD, standard deviation; Norm. Exp., normalized expression.

