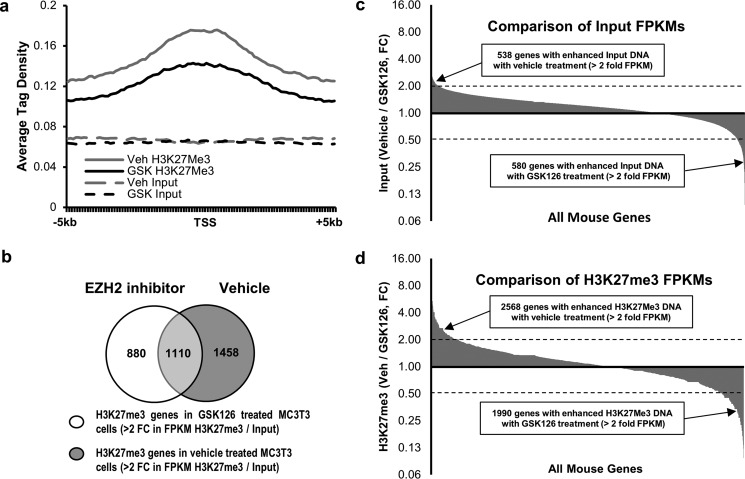
FIGURE 4.
Ezh2 inhibition reduces H3K27me3 marks near transcriptional start sites in MC3T3 cells. a, a plot of high confidence methylation peaks (FDR ≤ 1e-10) based on ChIP-seq analysis. Graph shows the average tag density from 5 kb upstream to 5 kb downstream of the TSS upon treatment with either vehicle or GSK126. b, a comparison of genes showing a greater than 2-fold increase in FPKM values between input DNA (before H3K27me3 ChIP) and the corresponding DNA after H3K27me3 ChIP. The data indicate that there are fewer genes showing H3K27me3 in MC3T3 cells after GSK126 treatment. c, comparison of FPKM values for the input DNA from MC3T3 cells treated with vehicle or GSK126. Less than 1% of all genes show greater than 2-fold difference in FPKMs between the two treatment groups. d, comparison of FPKM values from vehicle- and GSK126-treated MC3T3 cells after H3K27me3 ChIP. These data show an increased number of genes with greater than 2-fold difference between treatment groups indicating that Ezh2 inhibition changes the status of H3K27me3 marks near TSSs. After quality control, sequencing was performed on a single sample for pulldowns and inputs for each treatment condition. Veh, vehicle.

