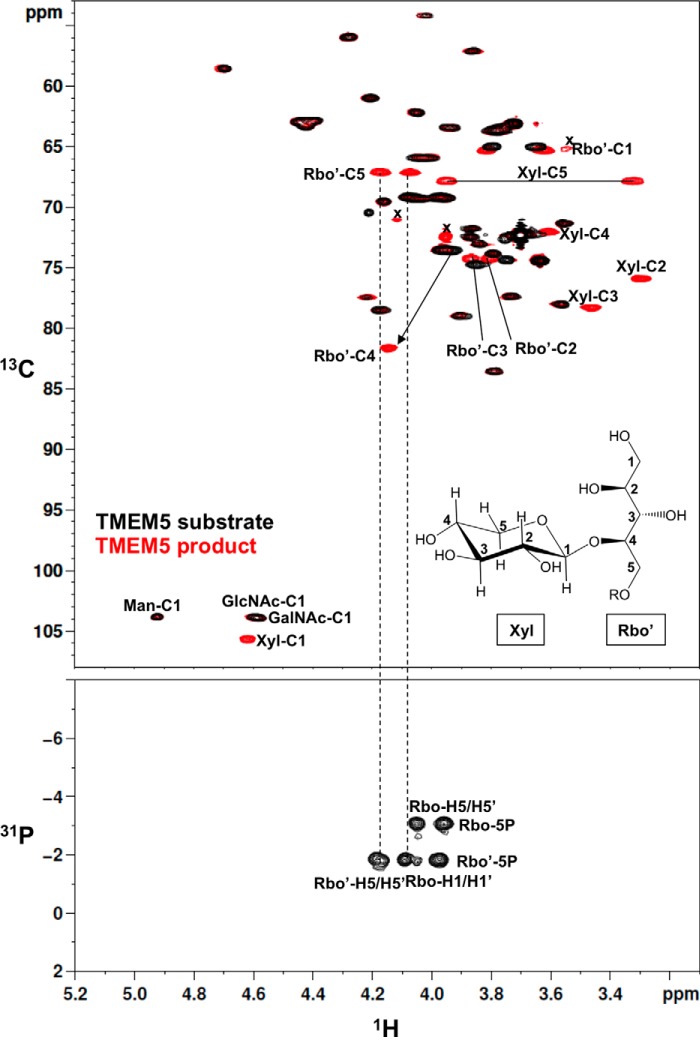
FIGURE 3.
Comparison of the NMR spectra of the TMEM5 substrate and its product. Upper panel, two-dimensional 1H-13C HSQC spectra of the TMEM5 substrate (black) and the TMEM5 product (red). Lower panel, two-dimensional 1H-31P HMBC spectrum of the TMEM5 product. Rbo, first ribitol; Rbo′, second ribitol; x, low molecular weight impurities. The NMR spectra were collected at 298 K.

