
FIGURE 4.
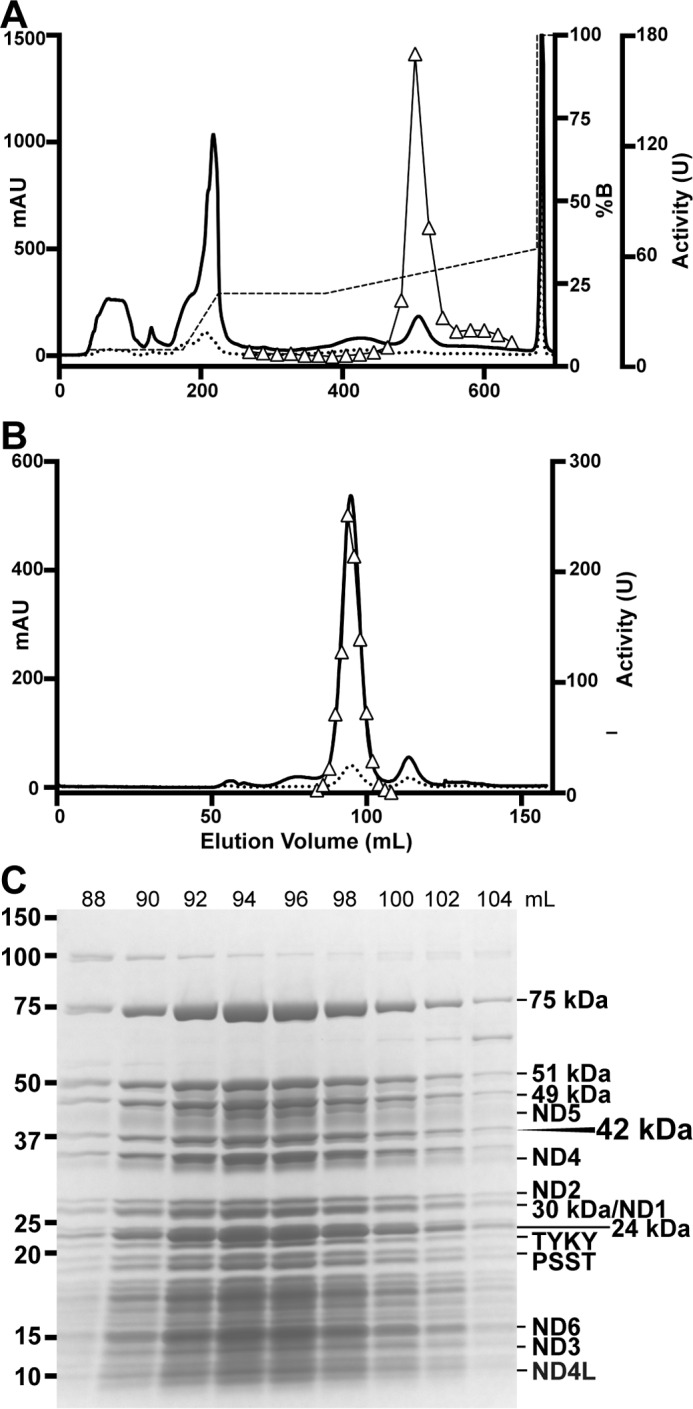
Ovine complex I purification in LMNG. A, Q-Sepharose anion-exchange chromatogram, A280 (solid line), A420 (dotted line), gradient (dashed line), and NADH/FeCy activity (triangles) are shown. B, Superose 6 size exclusion chromatogram, A280 (solid line), A420 (dotted line), and NADH/FeCy activity (triangles) are shown. C, SDS-PAGE of purified ovine complex I. Molecular weight standards are indicated on the left. The positions of core subunits are shown on the right, and the supernumerary 42-kDa subunit is indicated. mAU, milli-absorption units.