
FIGURE 8.
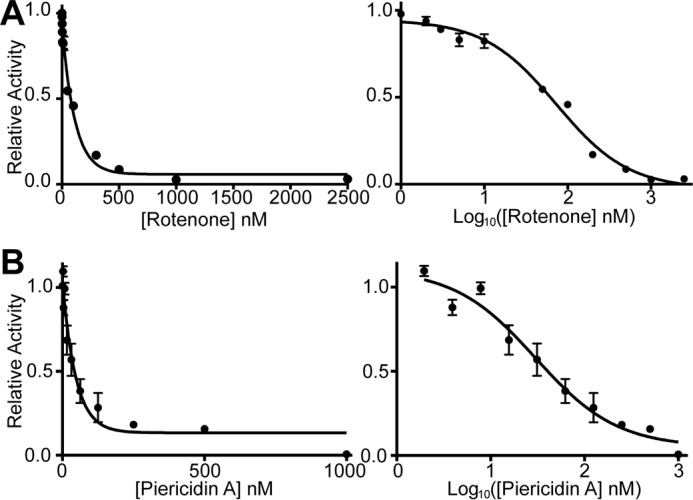
Rotenone and piericidin A sensitivity of ovine complex I purified in LMNG. A, inhibition of complex I by rotenone showing the concentration dependence (left) and the semi-log plot (right), n = 3, for each measurement. B, inhibition of ovine complex I by piericidin A showing the concentration dependence (left) and the semi-log plot (right), n = 3, for each measurement. Error bars show standard deviation.