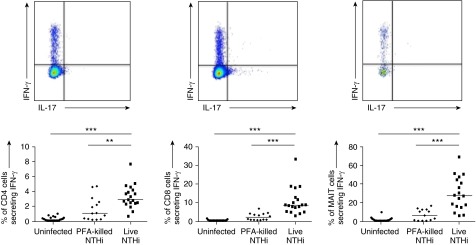
Figure 4.
Representative cytometry plots and graphs showing percentage of peripheral, healthy blood CD4+ T cells, CD8+ T cells, and Vα7.2+CD161+ MAIT cells expressing IFN-γ in response to monocyte-derived macrophages infected with live nontypeable Haemophilus influenzae (NTHi) or paraformaldehyde (PFA)-fixed NTHi at multiplicity of infection 10. Representative of at least 12 independent experiments. Bars indicate medians. P values represent Wilcoxon signed-rank tests. **P < 0.01; ***P < 0.001. MAIT = mucosal-associated invariant T.

