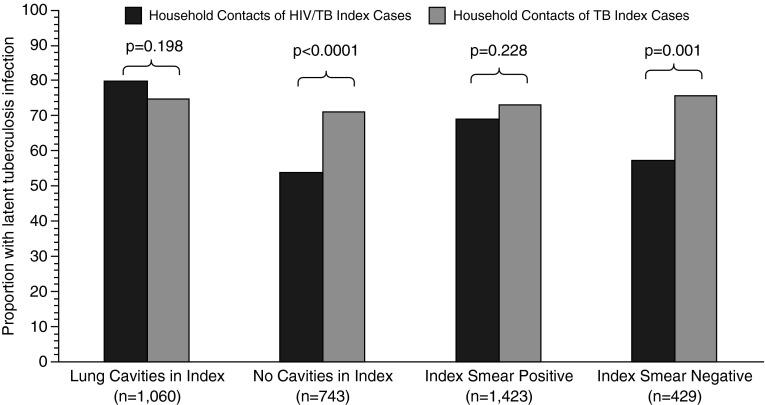
Figure 1.
Prevalence of latent tuberculosis (TB) infection in household contacts after stratification of the HIV serostatus of the index case and either cavitary status (n = 1,803) or smear status (n = 1,852) of the index case. Black bars represent prevalence of latent TB infection in household contacts of TB index cases coinfected with HIV after stratification for either cavitary disease or sputum smear positivity of the index case. Gray bars represent the prevalence of latent TB infection in household contacts of HIV-seronegative TB index cases after stratification for cavitary disease or sputum smear positivity of the index case. P values represent association after adjustment for within-household clustering of contacts.

