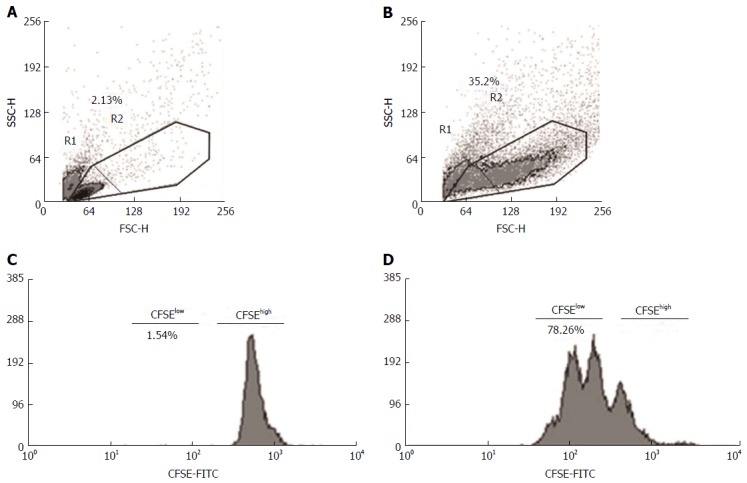
Figure 1.

Flow cytometry analysis of proliferating mononuclear cells in antigenic stimulation. Mononuclear cell populations were gated using forward (FSC) and side (SSC) scatter, and the dot plot identifies the total cells (R1 + R2), resting cells (R1) and blasts (R2). Peripheral blood mononuclear cells, either unstimulated (A and C) or stimulated with antigens (PHA, LPS or HAV Ag) (B and D), were labeled with CFSE. The histograms show the proportion of total (CFSElow + CFSEhigh), resting (CFSEhigh) and proliferating cells (CFSElow) observed using the Cyan flow cytometer and analyzed using the off-line software Summit version 6.0. CFSE: Carboxyfluorescein succinimidyl ester; PHA: Phytohemagglutinin; LPS: Lipopolysaccharide.
